2022 Q1 Recap and 2022 Q2 Outlook
Recapping the Bumpy 1Q 2022 Ride
The market is attempting to catch its breath as the first quarter of 2022 ends. There was no shortage of events for the market to navigate, including the Federal Reserve’s first interest rate increase since December 2018, Russia’s invasion of Ukraine, and stubbornly high inflation pressures. The series of events sent the S&P 500 and investors on a roller coaster ride. This quarter’s letter recaps the bumpy first quarter ride and discusses the key market themes impacting your portfolio.
Inflation Accelerates as Geopolitical Tensions Push Energy Prices Higher
2022 started the same way 2021 ended, with inflation accelerating faster in four decades. The Consumer Price Index, which measures inflation, rose +7.9% year-over-year during February 2022. It was the fastest pace since January 1982 and increased from 2021’s +7.1% annual pace. Inflation pressures remained broad, with the price of food, vehicles, and rent all increased significantly over the past 12 months.
Increasing geopolitical tensions in eastern Europe could intensify inflation pressures after Russia invaded Ukraine in February. Russia is a significant exporter of various commodities, including energy, aluminum, and wheat, and Russian sanctions raise the risk of supply shortages and higher prices for key commodities. WTI crude oil traded as high as $130 per barrel in early March, which was the highest level since 2008, while aluminum and wheat prices both reached record highs. The Bloomberg Commodity Index tracks a broad basket of energy, agriculture, and metal prices and is up ~27% year-to-date.
Data released during the first quarter indicates consumers are starting to feel the effect of higher gas prices at the pump and food prices in the grocery store. Figure 1 shows the University of Michigan’s consumer sentiment index dropped below 60 in March. Why is this significant? The chart shows the latest consumer sentiment reading is extremely negative compared to history. Prior readings under 60 occurred around high inflation in 1980, the 2008 financial crisis, and the 2011 U.S. credit rating downgrade. The sentiment is not typically this weak when the labor market is strong, and the S&P 500 is only ~5% below its record closing high.
Year-To-Date Change in US Treasury Bond Yields
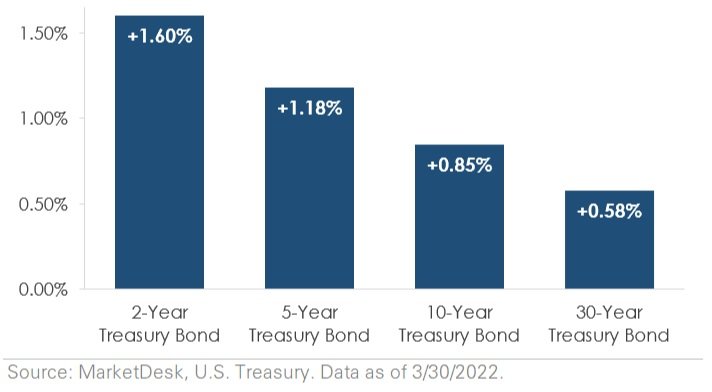
Treasury Yields Rise as the Federal Reserve Acts to Combat Persistent Inflation Pressures
Soaring inflation forced the Federal Reserve to raise interest rates for the first time since December 2018. The market widely anticipated the increase and was already moving rapidly to price in aggressive Federal Reserve tightening. Figure 2 graphs the absolute percentage change across key U.S. Treasury yields during the first quarter. It shows yields rose across the Treasury curve as markets prepared for more restrictive monetary policy and higher interest rates.
The Treasury yield movements provide a clue about the market’s forward expectations. Figure 3 shows the spread between long-term yields, such as the 30-year Treasury, and short-term yields, such as the 5-year Treasury, collapsed during the first quarter. Why did the spread tighten to near 0%? The short end of the Treasury yield curve is more sensitive to Federal Reserve policy, while the long end of the yield curve is more sensitive to economic conditions and the future outlook. The sharp move higher in short-term Treasury yields indicates the market expects the Federal Reserve to continue raising interest rates throughout 2022.
Why does the yield spread between bonds with two different maturities matter? Markets use the spread between long-term and short-term borrowing rates, such as those on the 30-year and 5-year Treasury bonds, to indicate investors’ assessment of economic growth and inflation prospects. What does a tighter spread signal? A tighter spread suggests investors are less positive on the forward outlook and may be willing to accept a lower rate of return to lend for a longer period of time. In contrast, a wider spread indicates investors are more positive about the outlook and therefore require a higher yield to compensate them for the opportunity cost of lending money for a longer time period. Based on the current 0.03% spread, investors appear to be concerned about the U.S. economic outlook.
Equity Market Recap – S&P 500 Experiences First Negative Quarterly Return Since Q1 2020
The S&P 500 generated a -4.6% return during the first quarter, outperforming the Russell 2000’s -7.5% return. Figure 5 shows it was the S&P 500’s first negative quarterly return since 1Q 2020 and the fourth worst quarterly return since 1Q 2013. The negative return is a significant change from 2021, when the S&P 500 registered a +28.6% annual total return.
Quarterly US Stock Market Performance
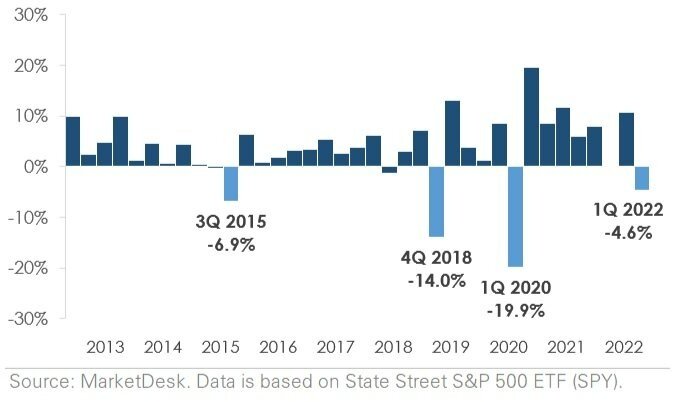
While the -4.6% return may seem shallow, it hides the S&P 500’s roller-coaster ride during the first quarter. U.S. stocks experienced significant selling pressure during January, with the S&P 500 suffering its biggest monthly selloff since March 2020. The selling pressure continued into February, and by early March, the S&P 500 was down -12.5% since the end of 2021. However, the performance turned around during the second half of March, with the S&P 500 registering a ~9% return. Following the rally, the S&P 500 ended the first quarter only -5% below its early January all-time record close.
There was a notable performance divergence between growth and value stocks during the first quarter. Russell 1000 Growth returned -9%, underperforming the Russell 1000 Value’s -0.7% return. As a reminder, growth stocks are valued based on their future earnings, and rising interest rates, such as Figure 2’s year-to-date increase, tend to decrease the valuation multiple markets places on those earnings. Within the S&P 500, Energy was the top performing sector, returning +39% as oil prices soared +30%. On the opposite end of the spectrum, Communication Services, Consumer Discretionary, and Technology were the three worst performing sectors due to their large Growth-factor exposures.
International stocks underperformed U.S. stocks. The MSCI EAFE Index of developed market stocks produced a -6.5% return during the first quarter, while the MSCI Emerging Market Index produced a -7.6% return over the same period. U.S. dollar strength was a headwind for international stocks during the first quarter as it caused additional currency translation losses.
2022 Outlook – More of the Same?
The outlook calls for current market themes to last throughout most of 2022. The Federal Reserve expects inflation pressures to ease as the year progresses, but there is a risk inflation will remain elevated longer than forecasted due to rising energy prices.
Given the magnitude of current inflation pressures and the risk of persistent inflation, the market expects more interest rate increases during 2022. The Federal Reserve’s next meeting is May 3-4, and the market expects the central bank to raise interest rates for a second consecutive meeting. However, there could be one significant difference ― multiple Federal Reserve governors recently highlighted the possibility of raising interest rates by 0.50%, or double the 0.25% increase seen at the March meeting, to ease inflation. While the difference may seem small, the market impact could be significant as trillions of dollars of assets react to the change.
There are many moving parts to pay attention to in the coming months. Investors will monitor economic data releases, corporate earnings, and geopolitical issues in eastern Europe for clues about the market’s next move. This year’s U.S. midterm elections will add another dimension as campaign season swings into gear over the coming months. As always, we recommend tuning out the political noise.
Our Insights