An Updated Timeline on Expected Interest Rate Cuts
Photo Credit: Anne Nygard, Unsplash
Ten months have passed since the Federal Reserve last raised interest rates. The pause in rate hikes follows a 17-month period where the central bank raised interest rates by +5.00%. It was the fastest and most aggressive rate-hiking campaign in decades, but the focus shifts to interest rate cuts as the central bank prepares its next policy move. The dashed lines in the chart below show the timing of anticipated rate cuts. At the beginning of 2024, investors expected the Federal Reserve to start cutting interest rates in March. It is now mid-May, and March passed without an interest rate cut.
What is preventing the Federal Reserve from cutting interest rates?
Inflation and employment data. The central bank has two main objectives: (1) price stability and (2) full employment. Price stability means low and stable inflation. Full employment means economic conditions that create new jobs and keep unemployment low. One of the tools the Federal Reserve uses to achieve these goals is interest rate changes. Rate hikes are used to combat inflation, while rate cuts are used to stimulate the economy as unemployment rises. During the 17-month tightening cycle, the Federal Reserve focused on lowering inflation. The central bank’s attention shifted toward its employment goal as inflation eased. There were concerns that higher interest rates could lead to higher unemployment, but this year’s data has forced the central bank to reconsider its priorities. Inflation was higher than expected in the first quarter, while unemployment remained below 4%. The low unemployment rate allows the Federal Reserve to focus more on reducing inflation.
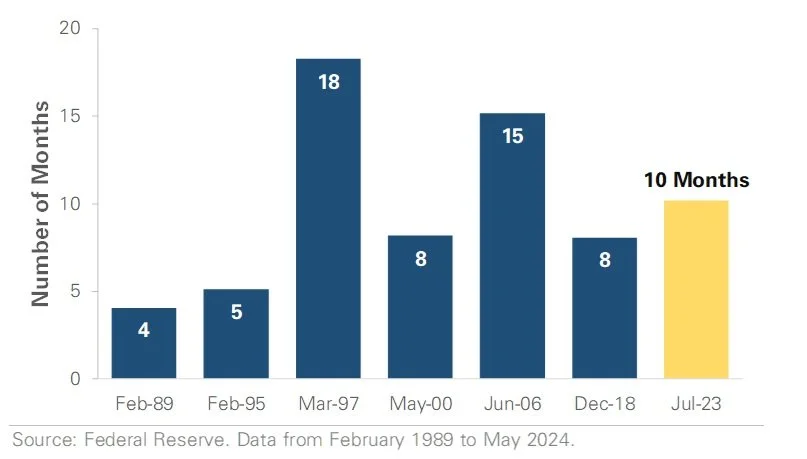
The market pushed back the expected timing of the first rate cut as inflation progress slowed. As shown in the chart below, investors now expect only one rate cut in 2024, down from six at the start of this year. Moreover, the first rate cut is not expected until Q4. If the market’s forecast is accurate and the Federal Reserve does not cut until December, a total of 17 months will have passed between the last rate hike and the first rate cut. How does this compare to history? Figure 2 graphs the time between the last hike and the first cut across prior tightening cycles. These ‘pause periods’ ranged from four months in 1989 to as long as 15 months in 2006 and 18 months in 1997. Compared to prior cycles, the current 10-month pause is longer than average. While the pause is longer than expected, history shows it’s not unprecedented.
Historical Fed Funds Rate and Current Market Projections
Number of Months Interest Rates Were Held Steady After Hiking Cycles
Important Disclosures
This material is provided for general and educational purposes only and is not investment advice. Your investments should correspond to your financial needs, goals, and risk tolerance. Please consult an investment professional before making any investment or financial decisions or purchasing any financial, securities, or investment-related service or product, including any investment product or service described in these materials.


