Inflation Data Comes in Cool, But is the Decline Seasonal?
Photo Credit: Ethan Robertson, Unsplash
Weekly Market Recap for June 14th
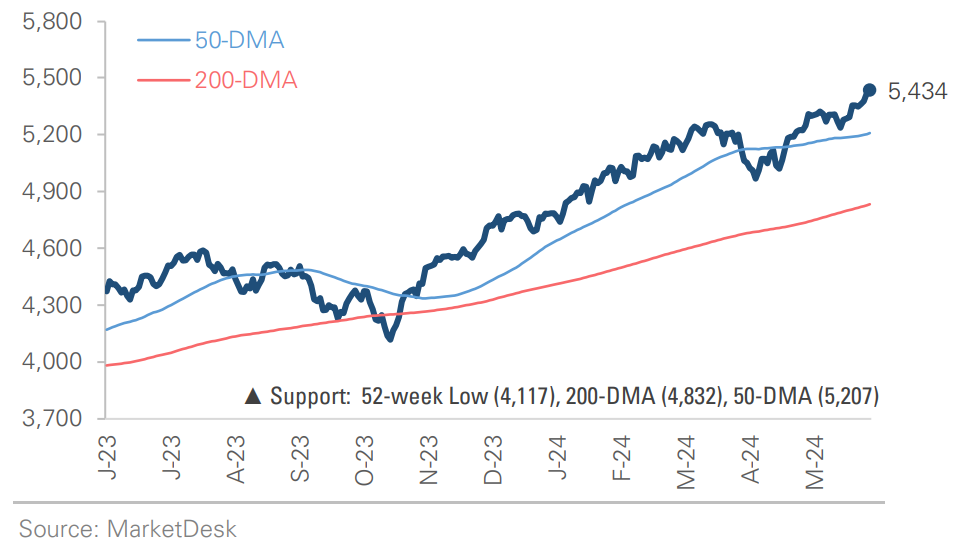
This week’s performance was top-heavy as the size factor continues to shape equity returns. The Magnificent 7 propelled the S&P 500 and Nasdaq 100 to new all-time highs, with Technology as the top performer. This week’s note discusses this year’s top-heavy return profile and how it’s distorting headline returns. In the credit market, bonds traded higher as yields fluctuated following a strong May payrolls report and cool CPI and PPI reports. Elsewhere, oil traded +4.1% higher, suggesting the recent decline in inflation may be short-lived.
S&P 500 Index (Last 12 Months)
S&P 500 Technical Composite (Last 24 Months)
May CPI & PPI Reports
After multiple months of hot reports, consumer and producer price inflation came in below estimate. Few economists and analysts predicted the slowdown, leading us to investigate and identify the drivers. Within CPI, the Energy index fell by -2% from the previous month. The Food index remained stable, increasing by +0.1%. The Commodities Less Food and Energy index (core goods) was unchanged, rising from -0.1% last month to no change. What caused the decline in CPI? The All-Items Less Food, Shelter, Energy, and Used Cars index (core goods and services) experienced a significant drop from +0.3% in April to -0.1% in May. This decline of -0.4% indicates that prices decreased across a wide range of categories. It is reminiscent of May 2023, when the core goods and services index fell from +0.3% in April to +0.0% in May. The headlines from the June 2023 data release were similar to those today:
“U.S. inflation is coming back down to Earth.”
“May CPI Report Suggests Inflation is Turning a Corner.”
“U.S. Inflation Slows, Giving Room for Fed to Pause Rate Hikes.”
The PPI report this week revealed a similar trend.
May CPI & PPI Reports Signal Easing Inflation
Price Increases are Seasonal
We pulled the monthly CPI core goods and services index going back to 1980. The chart below graphs the average change, with and without seasonal adjustments, by month. There is a calendar component to price increases. Spring and fall see the most significant nonseasonal increases, while summer and December experience the smallest. Seasonal factors are used to adjust the data, but even after adjustment, May still has one of the lowest increases. The data suggests that companies are less aggressive in raising prices during the summer, possibly because more employees are out of the office. There are several implications for the market. If history holds, the June CPI report may be lower than estimated, leading to a similar investor reaction: more rate cuts are forecasted, and the expected timing of the first cut is moving forward.
Additionally, if seasonal adjustments overstate inflation progress today and understate it later in the year, the market could be disappointed in the second half of 2024. We observed this last year, resulting in a -10% sell-off during Q3 2023 and early Q4. We expect inflation to decrease gradually; however, due to the seasonal nature of price increases, progress could be better as we enter the Fall months.
Median CPI Change by Month Since 1980
June FOMC Meeting
This week, the Fed held interest rates steady. The main update was the Summary of Economic Projections (SEP), which forecasts higher inflation this year, fewer rate cuts, and a higher terminal rate (Figure 5). The continued upward revisions to Core PCE and the 2025 and Longer Run fed funds rates caught our attention. Since December, the 2024 Core PCE estimate has been raised from 2.40% to 2.80%. Over the same period, the estimated 2025 fed funds rate was revised from 3.60% to 4.10%, while the terminal rate was raised from 2.50% to 2.80%. These rising inflation and fed funds rate estimates are the Fed’s way of acknowledging persistent inflation. One notable statement by Chair Powell during the press conference was, “If you’re at 2.6%, 2.7% PCE inflation, that’s a good place”. The result is a higher projected terminal rate, although there is little consensus on how to get there. The median forecast for the December 2025 fed funds rate is 4.10%, but the 2.9% to 5.4% range is wide. Given the potential for inflation noise and the Fed’s desire to avoid being seen as influencing the election, we don’t expect the first cut until late Q4.
Change in Fed's Summary of Economic Projections
Look Ahead to Next Week
The past two weeks were filled with significant macro events and the first round of May data releases, including ISM Mfg and PMIs, nonfarm payrolls, CPI and PPI data, and the June FOMC meeting. The chart below shows that Treasury yields have been highly volatile as investors react to each data point. It started with concerns about economic growth last week, which shifted to a strong labor market and easing inflation this week. In the upcoming week, retail sales, industrial production, and housing data will provide further insights into the state of the economy. However, we expect a strong market reaction if there is a significant beat or miss. Looking ahead to the end of June, implied volatility is decreasing as the calendar becomes less crowded, which should relieve a market whipsawed by news headlines.
The 10-Year Treasury Yield Remains Volatile
Important Disclosures
This material is provided for general and educational purposes only and is not investment advice. Your investments should correspond to your financial needs, goals, and risk tolerance. Please consult an investment professional before making any investment or financial decisions or purchasing any financial, securities, or investment-related service or product, including any investment product or service described in these materials.


