The Market Experiences a Big Deleveraging Event

Photo Credit: Nikolett Emmert, Unsplash
Weekly Market Recap for August 9th
This week, the market experienced significant deleveraging as it saw a decline in risk appetite: defensive sectors and gold outperformed, while the Small and High-beta factors underperformed. Stock and bond volatility spiked, but the credit market showed little sign of stress. The HY credit spread surged +1% early in the week before moving lower, and Treasury yields reversed higher after plunging early in the week. Crowded positioning and a sudden shift in the economic forecast after last week’s unemployment report fueled the deleveraging. For example, the DBMF managed futures ETF (trend following) lost -12% over the past month due to its short bond and Japanese yen positioning entering the second half of 2024. We expect residual volatility in the near term as the market seeks a new equilibrium.
S&P 500 Index (Last 12 Months)

S&P 500 Technical Composite (Last 24 Months)

Bullish and Bearish Narratives

Rising Unemployment Not Driven by Permanent Layoffs
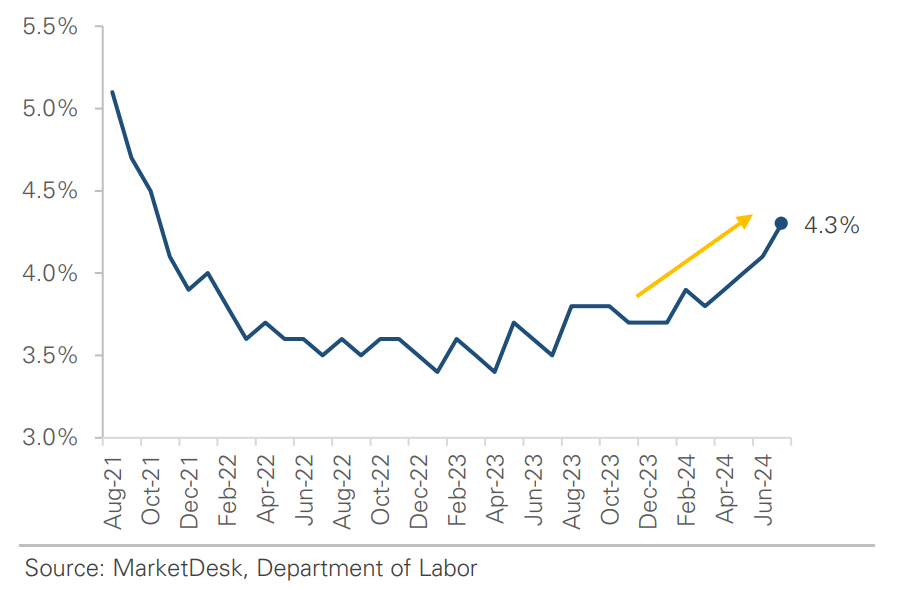
Unemployment rates are rising across age groups and genders. The long-term unemployed are taking longer to find jobs, and initial jobless claims are rising. Monthly job growth is slowing, total employment is flatlining, and prior months' estimates are being revised lower. The weakness showed up in recent months as unemployment rose from 3.8% to 4.3%, a nearly 3-year high. Some permanent job losses contributed, but many were due to workers re-entering the labor market and temporary layoffs. The reentrance theme can be seen in the prime-age (25–54) labor force participation rate, currently the highest since April 2001. The July surge in temporary layoffs, which includes people with a date to return to work or expect to return in the next 6 months, is difficult to interpret. It suggests employers are concerned enough to start reducing headcounts but hopeful that demand will recover enough to recall those employees.
Unemployment Rises to 33-Month High
Reason for Unemployment Change vs Prior Month

Prime Age Labor Force Participation Near 25-Year High

Labor Market is Stronger than Headlines Suggest
Our US Unemployment Indicator has shown the conditions are present for higher unemployment. The difficulty in forecasting this cycle has been structural changes. Over 5 million people left the labor market during the pandemic and haven't returned (i.e., early retirements), and the participation rate for individuals 55+ remains low. If those individuals returned, unemployment would likely be 5-6%, all else equal. Their leaving is why we believe unemployment will have a lower ceiling this cycle. Employment is a lagging indicator, so today's weakness is likely tied to conditions in mid- to late-2023. During that period, the 10Y surged to 5%, core durable goods orders declined, housing starts and building permits slowed, ISM Mfg PMI fell to 46, and consumer sentiment weakened. USURI forecasts a continued rise into early 2025, with a potential 2Q25 peak reflecting more recent favorable conditions.
US Unemployment Indicator

Putting the Market's Growth Scare into Historical Context
The market is experiencing a growth scare, causing the 2Y yield to fall -0.75% and the VIX to rise. Where does the market trade from here? The chart below shows the S&P 500’s return in the 6 months before and after two conditions are met: (1) the 2Y drops over -0.50% in 1 month, and (2) the VIX rises above 25. The combination identifies prior growth scares and significant market events, such as the early 1990s recession and oil price shock, the August 1998 Long Term Capital Mgmt. blowup, the 2000 dot-com bubble burst, the September 2001 attacks, and the 2008 financial crisis. Looking forward, the range of outcomes over the next six months is very wide, with a +/- 15% standard deviation. A strong 1H return suggests investors will buy the dip. However, balancing this optimism, it is worth noting that August is a seasonally weak period, and deleveraging events can take time to resolve fully.
S&P 500 Returns When 2Y Yield Drops and VIX Spikes

Look Ahead to Next Week
There is a long list of hard economic data next week, including PPI and CPI, retail sales, industrial production, and housing starts. The data will shed light on whether the market's recent growth scare is warranted.
This week's economic releases included:
Construction Spending
Actual: -0.30%
Consensus: +0.20%
Prior: -0.39%
Commentary: Second consecutive decline, with private & public falling. May revised down from -0.1% to -0.4%.
ISM Manufacturing PMI
Actual: 46.8
Consensus: 48.9
Prior: 48.5
Commentary: Fourth monthly decline and remains in contraction; demand slowed, output contracted, employment fell, and price pressures rose.
ISM Services PMI
Actual: 51.4
Consensus: 51
Prior: 48.8
Commentary: Back in expansion after slipping into contraction in April and June. Contradicts weak ISM Mfg PMI.
Important Disclosures
This material is provided for general and educational purposes only and is not investment advice. Your investments should correspond to your financial needs, goals, and risk tolerance. Please consult an investment professional before making any investment or financial decisions or purchasing any financial, securities, or investment-related service or product, including any investment product or service described in these materials.
Our Insights