The Next Two Weeks are Filled With Market-Moving Events
Photo Credit: Pascal Bullan, Unsplash
Weekly Market Recap for October 25th
This week, stocks traded lower after several weeks of consistent gains. The S&P 500 dropped -0.5%, underperforming the Nasdaq 100's +0.3% gain but outperforming the Russell 2000's -2.8% return. The Magnificent 7 rose over +2%, making Growth the only factor to trade higher. In contrast, High Beta, Value, Equal-Weight, and Low Volatility declined by over 1%, indicating that the average stock lagged behind the mega-cap concentrated S&P 500. The Consumer Discretionary sector led, as Tesla gained +20% after earnings, while Industrials and Materials both fell over -2%. Bonds continued to trade lower as Treasury yields rose, and long-duration bonds underperformed again. It is expected to see long-duration underperform early in the rate-cutting cycle. High-yield bonds continued outperforming, with credit spreads remaining near their lowest level since 2007. The U.S. dollar strengthened slightly, and oil prices edged up.
S&P 500 Index (Last 12 Months)
S&P 500 Technical Composite (Last 24 Months)
Market Cycle (September 2024)
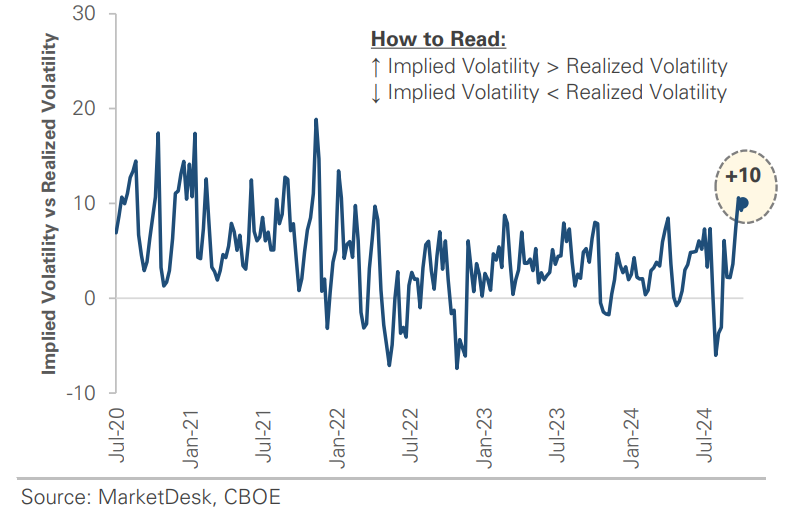
Implied Volatility is Elevated
The equity market is experiencing something notable: implied volatility is nearly 10 points higher than realized volatility. Implied volatility uses options prices to calculate the market’s expectations of future price movements, while realized volatility measures the actual historical price movement over a specific period. With the October nonfarm payrolls report on 11/1, the presidential election on 11/6, and the November FOMC meeting on 11/7, today’s high implied volatility indicates investors are hedged and cautious. Historically, when implied exceeds realized by 7 to 11 points, the S&P 500 tends to produce above-average returns over the next 3 and 6 months. Since 2001, when implied is 7 to 11 points above realized, the S&P 500’s median 3-month return is +4.3% with a 71% win rate.
In contrast, the return is +3.2% with a 68% win rate for all instances, regardless of the volatility gap. When implied volatility is high, the S&P 500’s median 6-month return is +7.1% with a 67% win rate, compared to +5.4% with a 71% win rate for all instances. The analysis shows that when implied volatility is high, as it is now, the S&P 500 tends to produce above-average 3- and 6-month forward returns, though not necessarily with a higher win rate. In such environments, the equity market typically has more upside potential. High implied volatility indicates that investors expect more uncertainty and large price swings, which causes them to price in higher risk premiums. However, if actual market conditions are less volatile than feared, prices could rise as the event passes and the risk premium decreases. The next two weeks are filled with market-moving events, and stocks could rally into year-end once they pass.
Investors Expect Increased Volatility
Gold Sets An All-Time High
US Treasury Yields Continue To Rise
Bonds Trade Lower Like in Prior Rate-Cut Cycles
US New Homes Sales Rise to a 16-Month High
Mortgage Applications Decline for a 4th Week
Market Liquidity is Deteriorating
The gap between implied and realized volatility signals the potential for above-average returns. A strong 1H S&P 500 return often leads to further gains in 2H. Two indicators provide additional insights and caution: the US Net Liquidity Indicator (USNLI) and the US Investor Sentiment Indicator (USSI). USNLI stands at 37%. The primary risk with low USNLI readings is not necessarily below-average returns but increased return volatility, making the equity market more prone to selloffs. The previous section showed that the market is hedged for increased volatility. Still, it is important to remain aware of the potential for volatility, like in late 2018, when the Fed engaged in quantitative tightening.
Investor Sentiment Sits at an Extreme
The US Investor Sentiment Indicator (USSI) is currently at 93%. Investor sentiment is highly positive. When there is an inverse relationship between USSI and forward returns, higher USSI readings historically lead to below-average returns and lower win rates, especially over extended periods. When the USSI is above 80%, as it is now, the probability of a significant selloff increases. This effect is more pronounced over 6- and 12-month periods, where stronger sentiment correlates with weaker forward returns. Pulling it all together, the high implied volatility suggests the market can trade higher into year-end as the upcoming event volatility rolls off. However, the low USNLI and high USSI reveal the pressure building underneath the surface as liquidity weakens and investor sentiment sits at an extreme. Early 2025 could prove challenging.
Looking Ahead
The event calendar will be busy during the next two weeks. Next week is the jobs report and Q3 earnings from Apple, Amazon, Microsoft, Meta, and Google-parent Alphabet. The election and FOMC meeting occur the following week. Each of these events has the potential to be market-moving and could lead to increased volatility. These events are well-known, and investors appear to be hedged. If the market emerges intact, stocks could end the year on a positive note.
Important Disclosures
This material is provided for general and educational purposes only and is not investment advice. Your investments should correspond to your financial needs, goals, and risk tolerance. Please consult an investment professional before making any investment or financial decisions or purchasing any financial, securities, or investment-related service or product, including any investment product or service described in these materials.


