1st Quarter Recap and 2025 Outlook

Photo Credit: Getty, Unsplash
Key Updates on the Economy & Markets
Stocks fell in the first quarter after two consecutive years of gains exceeding +20%. The year started strong, with the S&P 500 reaching a new all-time high in mid-February. However, sentiment shifted late in February amid rising policy uncertainty in Washington, and the S&P 500 ended the quarter down. There are many moving pieces in markets today, and we want to take a moment to share our team’s perspective. This post will recap the first quarter, discuss the drivers behind the recent market selloff, and provide an economic update.
Looking Back on the 2024 Stock Market Rally
The big development in Q1 was falling stock market valuations as rising policy uncertainty weighed on investor sentiment. The chart below provides context around the recent pullback, highlighting the divergence between earnings estimates and valuations. The dashed blue line graphs the rolling 12-month earnings forecast for the S&P 500, reflecting Wall Street analysts’ profit expectations for the year ahead. The navy shading graphs the S&P 500’s price-to-earnings (P/E) ratio, or how much investors will pay for those future earnings. The chart shows earnings estimates tend to be less volatile than P/E ratios, which is natural as the market often swings between optimism and pessimism. The shift in sentiment during Q1, from optimism to caution, caused valuations to decline and stocks to fall.
The right side of the below chart shows that Wall Street analysts slightly lowered their earnings forecast in Q1, citing the potential for tariffs and slower growth. Meanwhile, the S&P 500’s P/E ratio declined from over 22x to around 20x. The valuation decline may seem modest, but it had a meaningful effect on returns. Those falling valuations were the primary driver of the selloff as sentiment weakened. Investors started to price stocks more conservatively due to concerns about tariffs, slower economic growth, and policy uncertainty.
Company size impacted quarterly returns as market leadership shifted and last year’s top performers lost momentum. Last year, the Magnificent 7, a group of leading tech stocks that includes Nvidia, Microsoft, Alphabet, Amazon, Tesla, Apple, and Meta, delivered an impressive +63% return. The group’s strength lifted the broader market, with the S&P 500 gaining +23%. In contrast, the equal-weight S&P 500, which gives all companies the same weight regardless of size, gained only +11%. This year, the dynamic has flipped. Instead of lifting the market, the biggest stocks are dragging it down. The Magnificent 7 has declined -15% year-to-date, while the equal-weight S&P 500 is down only -1%. The takeaway: smaller companies held up better during the selloff.
Earnings Remain Strong as Valuations Decline

Rising Policy Uncertainty is Impacting Sentiment
Developments in Washington took center stage in Q1 as the Trump administration started rolling out its policy agenda. The administration’s early efforts focused on trade policy, tariffs, and reducing government spending. The policies are a notable shift from the status quo and have drawn the attention of investors and business leaders due to their potential economic impact.
The charts below graph three measures of sentiment. The datasets provide insight into how households, business leaders, and investors view current conditions and what they expect in the future. Tracking sentiment can help gauge potential shifts in consumer spending, business investment, and overall economic momentum.
These sentiment measures signal a more cautious tone among consumers, business leaders, and investors. This matters because sentiment can impact future behavior. Consumers may reduce spending, while businesses may delay hiring or investment decisions. Sentiment data will remain in focus in the coming months as more policy details are released.
Consumer Sentiment Survey
The Consumer Sentiment Survey graphs the University of Michigan’s Consumer Sentiment Index, which tracks how optimistic or pessimistic consumers feel about the economy. Consumer sentiment weakened early in the pandemic and hit a record low in June 2022. The decline reflected concerns about rising inflation, expectations for higher interest rates, and broader economic uncertainty. Sentiment gradually recovered from late 2022 through the end of 2024 as inflation eased, economic growth exceeded expectations, and stocks set record highs. However, sentiment has turned downward again in early 2025. The reversal signals renewed concern among consumers, who have been a key driver of economic growth in recent years.

Source: University of Michigan
CEO Confidence Index
The CEO Confidence Index graphs The Conference Board’s CEO Confidence Index measures how optimistic business leaders are about conditions. Since the 2010s, the index has fluctuated between 5 and 8. Recent years were especially volatile due to pandemic disruptions, persistent inflation, high interest rates, and geopolitical and policy uncertainty. In Q1, the index fell to 5.0, the lowest level since October 2011. The decline signals increased caution among CEOs as they navigate changing policy, the potential for tariffs, and an uncertain economic environment.

Source: The Conference Board
Chicago Board of Options Exchange VIX
The CBOE VIX graphs market volatility during the first quarter, as measured by the CBOE Volatility Index (VIX). Volatility increased in early 2025, starting in mid-February. Some market volatility is normal, but the recent spike occurred as policy uncertainty increased and the stock market sold off. Markets dislike uncertainty, and market volatility could remain elevated until more clarity.

Source: CBOE
An Update on the US Economy
It is important to remember that the stock market is not the same as the economy. In other words, the stock market’s performance does not always reflect real-time economic conditions. This happens because the market is forward-looking, with prices based on expectations for what is to come. The previous section highlighted how rising policy uncertainty affected sentiment in Q1, and this section examines the latest economic data. The chart below graphs four economic indicators that provide insight into the state of the U.S. economy: the unemployment rate, retail sales, housing starts, and industrial production.
Together, the data suggest that the U.S. economy is losing some momentum. However, it also shows that the economy continues to expand, albeit at a slower pace. The labor market remains solid, and consumer spending is holding steady. The housing sector has cooled from its pandemic highs, but it still exceeds the pace seen in the 2010s. Meanwhile, manufacturing activity is displaying renewed strength. The risk moving forward is that policy uncertainty could weigh on confidence and trigger a slowdown. Economic data will be in focus in the coming months.
Unemployment Rate %
The unemployment rate remains low by historical standards. Unemployment rose in 2023, and job growth slowed in the first half of 2024 as workers reentered the labor market. This led to concerns about the labor market softening and contributed to the Federal Reserve’s decision to cut interest rates in September 2024. However, unemployment has recently decreased as monthly job growth has increased. The data points to a resilient labor market, with worker demand rising against a relatively tight labor market.

Source: US Department of Labor, US Census Bureau, Federal Reserve
Retail Sales (Y/Y%)
Growth was strong in 2023, supported by rising wages and the continued drawdown of pandemic-era savings. However, growth slowed in 2024, indicating that while households continue to spend, they’re doing so more cautiously. Potential factors include high interest rates, persistent inflation, and a return to more typical spending patterns. Consumer spending is almost 70% of the US GDP so that a continued slowdown could affect the broader economy.

Source: US Department of Labor, US Census Bureau, Federal Reserve
New Home Starts (Y/Y%)
The housing market slowed in recent years as it struggled with high mortgage rates and decreasing affordability. Homebuilders hesitated to take on new projects amid weaker demand and elevated borrowing costs, and recent policy announcements created more uncertainty. Tariffs and immigration policies create potential challenges for builders, as they may raise material costs and decrease labor availability. However, despite the headwinds, housing starts are still above pre-pandemic levels.

Source: US Department of Labor, US Census Bureau, Federal Reserve
Industrial Production (Y/Y%)
Industrial production measures the total output of factories, mines, and utilities across the economy. Industrial activity was flat or declined in 2023 and 2024 as high interest rates and economic uncertainty dampened business investment. More recently, industrial output has shown signs of recovery, with industrial production growing fastest since late 2022. The rebound likely reflects expectations for lower interest rates and the resolution of uncertainty after last year’s election. The question is how tariffs will impact manufacturing as 2025 progresses.

Source: US Department of Labor, US Census Bureau, Federal Reserve
Equity Market Recap – Looking Beyond the Index
Most of the stock market decline occurred in the second half of the quarter after the S&P 500 set a new all-time high on February 19th. As mentioned earlier, a small group of mega-cap stocks drove the selloff, and their size and weight within broad stock market indices impacted performance trends. The Growth factor, which holds many high-profile mega-cap stocks, returned -10% in Q1. Similarly, the Nasdaq 100, an index of leading technology companies that includes the Magnificent 7, returned -8%.
Sector returns highlight the concentrated nature of the selloff. Nine of the eleven S&P 500 sectors outperformed the broad index at the start of the year. Seven of those sectors posted gains, while the other two remained flat. This marks a sharp contrast to last year, when a handful of sectors drove the S&P 500’s gains. Technology and Consumer Discretionary, two of last year’s top performers, are the worst-performing sectors this year. It’s not a coincidence that these sectors are the most exposed to the Magnificent 7, which has impacted their returns just like the broader S&P 500. In contrast, the sectors underperforming in 2024 are the top performers this year. While the S&P 500 is down by 4.3%, the average stock within the index is down by 1%.
International stocks outperformed U.S. stocks in Q1, marking one of the largest quarters of outperformance since 2000. The lagging performance of U.S. mega-cap tech stocks contributed to the international outperformance. Outside the U.S., the MSCI EAFE Index of developed market stocks rose by +8% in Q1. Much of this strength originated from Europe, where investor sentiment improved as governments revealed plans to increase spending. This prompted a shift from U.S. stocks towards Europe, as investors anticipated increased government spending would lead to stronger economic growth. Meanwhile, the MSCI Emerging Markets Index gained +4.5% in Q1, underperforming the developed index but outperforming the S&P 500 by nearly +9%.
Credit Market Recap – Bonds Trade Higher in the 1st Quarter
Two notable themes in the bond market in Q1 were falling US Treasury bond yields and wider credit spreads. The 10-year Treasury yield fell from a peak of around 4.80% in mid-January to 4.15% in early March. It was a reversal from Q4, when the 10-year yield rose more than +0.75% due to renewed inflation concerns. Several factors contributed to the Q1 reversal, including rising policy uncertainty, the potential for tariffs, and concerns about slower economic growth. The combination prompted investors to move money into longer-maturity government bonds, which are viewed as safe havens. Bond prices rose as yields declined, and Treasury bonds provided diversification benefits in Q1, offsetting a portion of the stock market decline.
Another major theme was credit spread expansion. Credit spreads measure the difference in yield between high-yield corporate bonds and safer government bonds, such as US Treasuries. Spread levels can serve as a real-time gauge of market sentiment, showing how easy or expensive companies can borrow money. A narrower spread signals that investors view credit risk as low, while a wider spread signals a higher perceived default risk.
High Yield Bond Credit Spread
The chart below graphs the high-yield credit spread since 1997. The high-yield spread narrowed in late 2024 as the Federal Reserve cut interest rates, reaching levels last seen in 2007. However, the yellow circle shows that credit spreads widened in Q1. The increase indicates that investors are becoming more cautious, with the potential for tariffs and slower economic growth leading to higher credit risk.
Despite the recent rise, the chart shows credit spreads remain low by historical standards. Compared to past periods of market stress, today’s spread levels suggest financial conditions are still relatively stable, a reflection of the U.S. economy’s overall strength. While investors are concerned about policy uncertainty and the potential for slower growth, the market is not signaling financial distress. However, if spreads continue to widen, it could signal tighter financial conditions and raise concerns about potential defaults. The market will be watching spreads closely.

2025 Outlook – Maintaining a Long-Term View
Market volatility can be unsettling, but it is a normal part of investing. Periods of enthusiasm often lead to recalibration. It is natural to feel uncertain, but history shows that staying invested through volatility and maintaining a longer-term perspective is prudent.
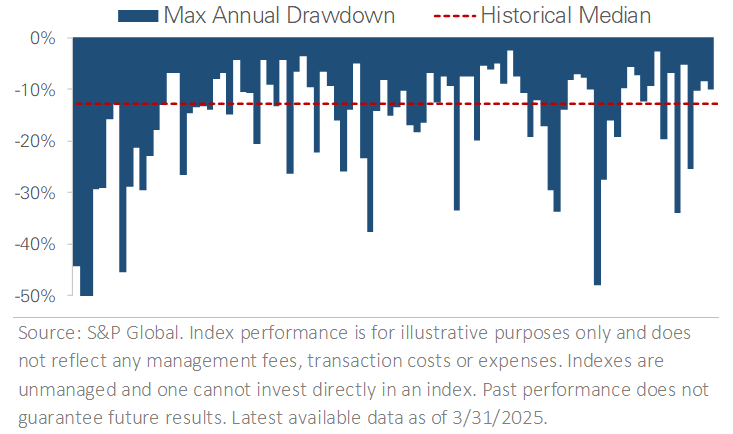
The chart below puts the Q1 market volatility and selloff into perspective. It uses almost a century of S&P 500 price data to show that market pullbacks like this year are not just common—they are a healthy and recurring part of investing. The chart graphs annual drawdowns or the largest peak-to-trough decline within each calendar year. The bars show the S&P 500 experiences a pullback nearly every year, with a median intra-year drawdown of -13%. Since 1928, the S&P 500 has experienced a drawdown of -5% or more in 91 out of 98 calendar years, including 2025.
S&P 500 Maximum Drawdown by Year
Important Disclosures
This material is provided for general and educational purposes only and is not investment advice. Your investments should correspond to your financial needs, goals, and risk tolerance. Please consult an investment professional before making any investment or financial decisions or purchasing any financial, securities, or investment-related service or product, including any investment product or service described in these materials.
Our Insights


