Market Capitulation, Latest Economic Data, Fed Meeting Recap

Photo Credit: Kevin Ianeselli, Unsplash
Weekly Market Recap for March 21st
Stocks rebounded this week, ending a 3-week losing streak. The rebound was led by riskier equity classes, including the Russell 2000, High Beta, and cyclical sectors. Despite the rebound, YTD underperformers, which include the Magnificent 7 and the Mega-Cap factor, continued to underperform. Their underperformance held back both the S&P 500, which lagged Equal-Weight, and the Growth factor. High-yield bonds outperformed in the credit market as credit spreads tightened from last week’s 6-month high. Market volatility eased, with the CBOE VIX and bond volatility declining. The market correction felt like capitulation, helping to spark this week’s rebound, but the oversold conditions might be overstated due to the low volatility world we have come from. Ultimately, economic data will decide how long the current market drawdown lasts.
S&P 500 Index (Last 12 Months)

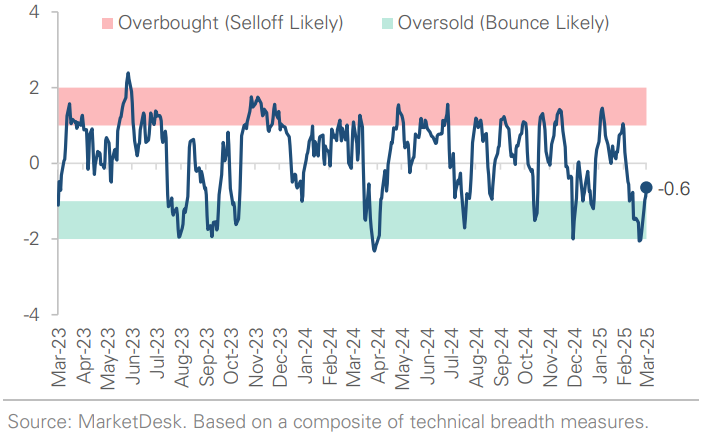
S&P 500 Technical Composite (Last 24 Months)
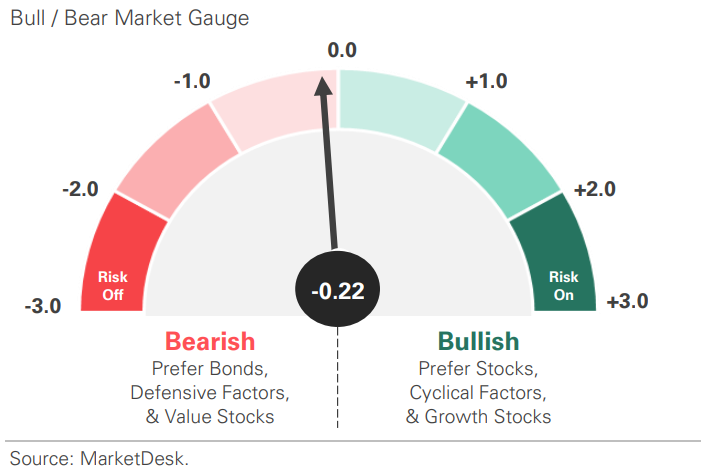
Bull Bear Market Indicator
US Market Economic Cycle

Key Takeaways
#1 - Our US Capitulation Indicator (USCAP) fell below -2 standard deviations last week
Based on various momentum metrics, this indicator measures how dislocated the market is against the past few years. Readings below -2std are considered "oversold" and historically offer great long-term buying opportunities. Last week's reading was the lowest since May 2022.
US Capitulation Indicator

#2 - USCAP Highlights the Recent Lack of Volatility
The selloff is taking place in the context of what had been a low-volatility environment, with steadily rising stock prices. As volatility increases off such a low base, moves can appear bigger, leading to feelings of capitulation.
Implication: USCAP may be overstating the selloff this cycle compared to the low-volatility world of 2023-2024.
#3 - USCAP Has Only Fallen Below -2std Twice Early in USRDI Risk Off Regimes
USCAP fell below -2std in July 2007 and July 2011. The S&P 500 bounced in both instances, but the economy determined the market’s longer-term path and the style of the risk-off regime. In 2007, the selloff preceded the 2008 financial crisis and a bear market. In 2011, a period of consolidation ensued, with the U.S. debt downgrade not tied to deeper structural issues.
Implication: The economy will determine the sustainability of the bounce and whether this is a bear market or a consolidation phase.
US Risk Demand Indicator

#4 - Consumer Spending Rebounded
Retail sales increased +0.3% m/m after a -1.2% drop in January. Core retail sales (ex autos & fuel) rose +0.47% after last month's -0.84% decline, but the big story was a +1.0% surge in control group retail sales, which feed into GDP growth and plunged -1% last month.
Implication: The rebound helps ease concerns that the consumer, a key driver of economic growth, is starting to pull back.
Consumer Spending Rebounds in February

#5 - Housing Data Showed Mixed Signals
After January's weather-related disruptions, housing started rebounding at +11.2% m/m. However, building permits fell -1.2% m/m, the largest decline in five months, indicating that the start surge may be short-lived.
Implication: Housing continues to see little benefit from rate cuts, with builders facing the threat of tariffs, higher raw material prices, and immigration policies impacting labor supply.
Housing Starts Jump After January Slowdown

US Buiding Permits

#6 - Industrial Production Expands for a Third Straight Month
Industrial production rose by +0.7% m/m in February. There was broad strength across categories, with the Manufacturing subindex jumping +0.89% m/m after stalling in January.
Implication: The rebound helps ease fears of an imminent recession, but the auto industry accounted for a large portion of the increase. Tariff threats remain a risk to the broader manufacturing sector.
#7 - The Fed Held Rates Steady This Week as Expected
The main event was Chair Powell’s press conference, where he downplayed concerns about tariffs, inflation, and an economic slowdown. Meanwhile, Fed officials lowered their growth forecast, raised their inflation and unemployment forecasts, and continued to signal two cuts. The big shock: the Fed tapered its quantitative tightening program, a move that no one had on their bingo card.
Implication: The Fed acknowledges the potential for a slowdown but is not in a hurry to cut interest rates.
Important Disclosures
This material is provided for general and educational purposes only and is not investment advice. Your investments should correspond to your financial needs, goals, and risk tolerance. Please consult an investment professional before making any investment or financial decisions or purchasing any financial, securities, or investment-related service or product, including any investment product or service described in these materials.
Our Insights


