3Q 2022 Recap and 4Q 2022 Outlook

Photo Credit: Brendan Church, Unsplash
Market Searches for Direction During Third Quarter
At the risk of being repetitive, financial markets were unsettled and volatile during the third quarter. The stock market’s trend changed multiple times intra-quarter as investors reacted to data and repositioned portfolios. The S&P 500 finished the third quarter down -4.9%, while the 2-year Treasury yield reached levels not seen since 2007. This letter recaps the third quarter and provides an update on the key questions markets faced at the start of the third quarter.
Inflation Dynamics & Direction of Fed Policy
Markets received new inflation data and updated commentary from the Federal Reserve during the third quarter. Data showed inflation pressures, as measured by the year-over-year (y/y) growth rate of the Consumer Price Index (CPI), eased for a second consecutive month during August. The decline in inflation occurred against a backdrop of falling energy prices, with AAA reporting the average cost of a gallon of gasoline down -27% since peaking at $5.01 in early June. Markets cheered the two consecutive monthly inflation declines, hoping June’s +9% y/y inflation growth rate would mark inflation’s peak.
Easing inflation pressures are a welcome development, but underlying data indicates inflation remains persistent across a broad range of categories. Unlike the headline CPI reading, the core CPI reading, which excludes the volatile food and energy categories, was higher during August: June +5.9% y/y; July +5.9% y/y; and August +6.3% y/y. The divergence, with core CPI rising and headline CPI falling, grabbed the market’s attention and led the Fed to step up its tightening efforts to prevent inflation from becoming entrenched.
Interest Rate Increases Across Tightening Cycles

Entering the third quarter, the Fed had just raised interest rates +0.75% during June. It was the first +0.75% increase since 1994. Keeping its foot on the pedal, the Fed followed up June’s extra-large interest rate increase with +0.75% increases at the July and September meetings. The Fed also updated its Summary of Economic Projections at the September meeting for the first time since June. The Fed now projects the benchmark federal funds rate will end 2022 at 4.40%, which implies another +1.25% of interest rate increase by year-end. Back in June, the Fed’s year-end projection was 3.40%. If there was any doubt before, the Fed takes inflation’s threat extremely seriously.
Economic Activity Normalizes After Robust Growth
The path of economic growth and the strength of the U.S. economy was another open question entering the third quarter. Data showed the U.S. economy shrank by -0.6% on an annualized basis during the second quarter. The negative reading followed the first quarter’s -1.6% annualized decline and met the technical definition of a recession, which is defined as two consecutive quarters of negative GDP growth. It’s an indication the U.S. economy is slowing after a period of robust growth during the pandemic recovery.
While the prospect of slower growth and a recession are concerning, there are a few important points to remember. First, recessions come in all shapes and sizes. All recessions are different, and there is no predefined path. In our view, the current environment is even more unique due to the nature of the global pandemic, the impact of multiple rounds of fiscal and monetary stimulus, and inflation readings at a 40-year high. Second, it is still too early to determine the degree of the current slowdown or how long it will last.
Our team will monitor labor market data, industrial activity, and housing data in the coming months to better understand the U.S. economy’s trajectory.
Corporate Commentary Ahead of Earnings Season
Corporate earnings were another open question entering the third quarter. Companies benefited from robust demand during the recovery from the pandemic due to low-interest rates and pent-up demand. Pricing power allowed companies to pass through their increased costs, which led to higher profit margins. The S&P 500 earnings per share grew +6.3% y/y during the second quarter, a slowdown from the first quarter’s +9.3% y/y growth rate. The slowdown raises an important question: Can companies continue to grow earnings as higher interest rates slow economic activity and employees demand higher wages? FactSet’s S&P 500 Earnings Scorecard indicates analysts expect earnings growth to remain positive but slow to +2.6% y/y during the third quarter.
The third quarter earnings season won’t officially kick off until mid-October, but companies are already providing updates. FedEx, which includes transportation, logistics, and freight services, released a downbeat business update ahead of its September 22nd earnings release. The company disclosed its quarterly results were negatively impacted by soft global package volumes and withdrew its previous fiscal year 2023 guidance. FedEx plans to cut costs by reducing its flight schedule, closing 90 FedEx Office locations and five corporate office facilities, and deferring hiring. Olin Corporation, which manufactures chemical products, also reported a noticeable decline in global economic conditions and lowered its guidance.
In contrast, other companies continue to report strong demand. General Mills, which manufactures a variety of consumer foods, recently raised its full-year sales forecast due to higher food prices and strong demand for cereal, snacks, and pet food. Coty, which sells beauty products, increased its revenue guidance due to more robust beauty demand. The CFO of MGM Resorts, which operates casinos, reported the company set records at its Las Vegas properties during the second quarter. There are apparent differences in the companies’ end markets and cyclicality, but the guidance updates and management commentary are another conflicting signal for markets to decipher.
Equity Market Recap – A Boom-and-Bust Quarter
The third quarter was an up-and-down quarter in the equity market, literally. Figure 2 tracks the S&P 500’s price during the quarter. The S&P 500 Index of large-cap stocks returned -4.9% during the third quarter, underperforming the Russell 2000 Index’s -2.1% return. However, the slight loss hides the market’s two extremes. The quarter started with the S&P 500 gaining approximately +14% through August 16th as expectations for a shorter tightening cycle and a potential 2023 interest rate cut propelled stocks higher.
S&P 500 Return Path During 3rd Quarter 2022

Following the roller-coaster ride, the S&P 500 ended the third quarter slightly below where it started the quarter. However, the trend swiftly reversed around mid-August, and the S&P 500 gave back all its gains since July 1st, plus more. The late third quarter sell-off was driven by an unwind of investors’ hopes for a shorter tightening cycle and a 2023 interest rate cut. The August inflation report highlighted inflation’s persistence, and updated Fed commentary threw cold water on the market’s early quarter enthusiasm.
After a challenging first half of 2022, growth stocks started to find their footing during the third quarter. The Russell 1000 Growth Index traded down -3.5%, outperforming the Russell 1000 Value Index’s -5.6% return despite rising Treasury yields. Even the Nasdaq 100 Index, which represents a concentrated growth index due to its technology sector overweight, outperformed the S&P 500, trading down only -4.5%. Growth’s outperformance may signal the start of a new investment regime.
Why?
Declining valuation multiples primarily drove the first half of 2022 sell-off as interest rates increased. Growth’s third-quarter outperformance suggests investors are less concerned about the risk of lower valuation multiples and more concerned about slowing economic growth. The growth factor’s sector exposure is less cyclical than value.
U.S. sector returns varied with no apparent performance trend during the third quarter. Despite soaring inflation and pressure on household budgets, Consumer Discretionary was the top performing S&P 500 sector, with the gains primarily driven by Tesla. The energy sector was the only other sector to produce a positive return. The remaining sectors were mixed, with no clear defensive or cyclical trend. The middle-of-the-pack sectors included three defensive sectors (Utilities, Health Care, and Consumer Staples), three cyclical sectors (Materials, Industrials, and Financials), and one growth-style sector (Technology). Communication Services and Real Estate both traded down more than -11.0%.
International markets underperformed the S&P 500 during the third quarter. The MSCI EAFE Index of developed market stocks returned -10.4% during the quarter, while the MSCI EM Index of emerging market stocks returned -13.0%. International markets faced various headwinds during the quarter, including Europe’s energy crisis and China’s struggle to reopen and return to growth after its Covid-zero policy. In addition, a strong U.S. dollar, which produces currency translation losses when investments are translated back into USD, weighed on international stocks.
Bond Market Recap – Treasury Yields Rise as Market Anticipates More Interest Rate Increases

Bonds continued to trade lower during the third quarter as Treasury yields rose to decade-plus highs in anticipation of tighter Fed policy. The 2-Tear Treasury Note Yield Chart shows the 2-year yield is sitting at the highest level since August 2007. To put this year’s spike in bond yields into perspective, the 2-year yield was just 0.73% on 12/31/2021 but now sits at 4.20%. This year, the parabolic increase in Treasury yields provides a visual depiction of the Fed’s aggressive interest rate increases.
Fourth Quarter 2022 Outlook – Keeping an Eye on the Big Picture
It’s been a challenging year for both the stock and bond markets. The S&P 500 Index has produced a -23.8% total return year-to-date, while the Bloomberg U.S. Bond Aggregate has generated a -14.3% total return. This year’s sell-off is particularly challenging because bonds, which historically act as a portfolio hedge during market turmoil, have traded down with stocks.
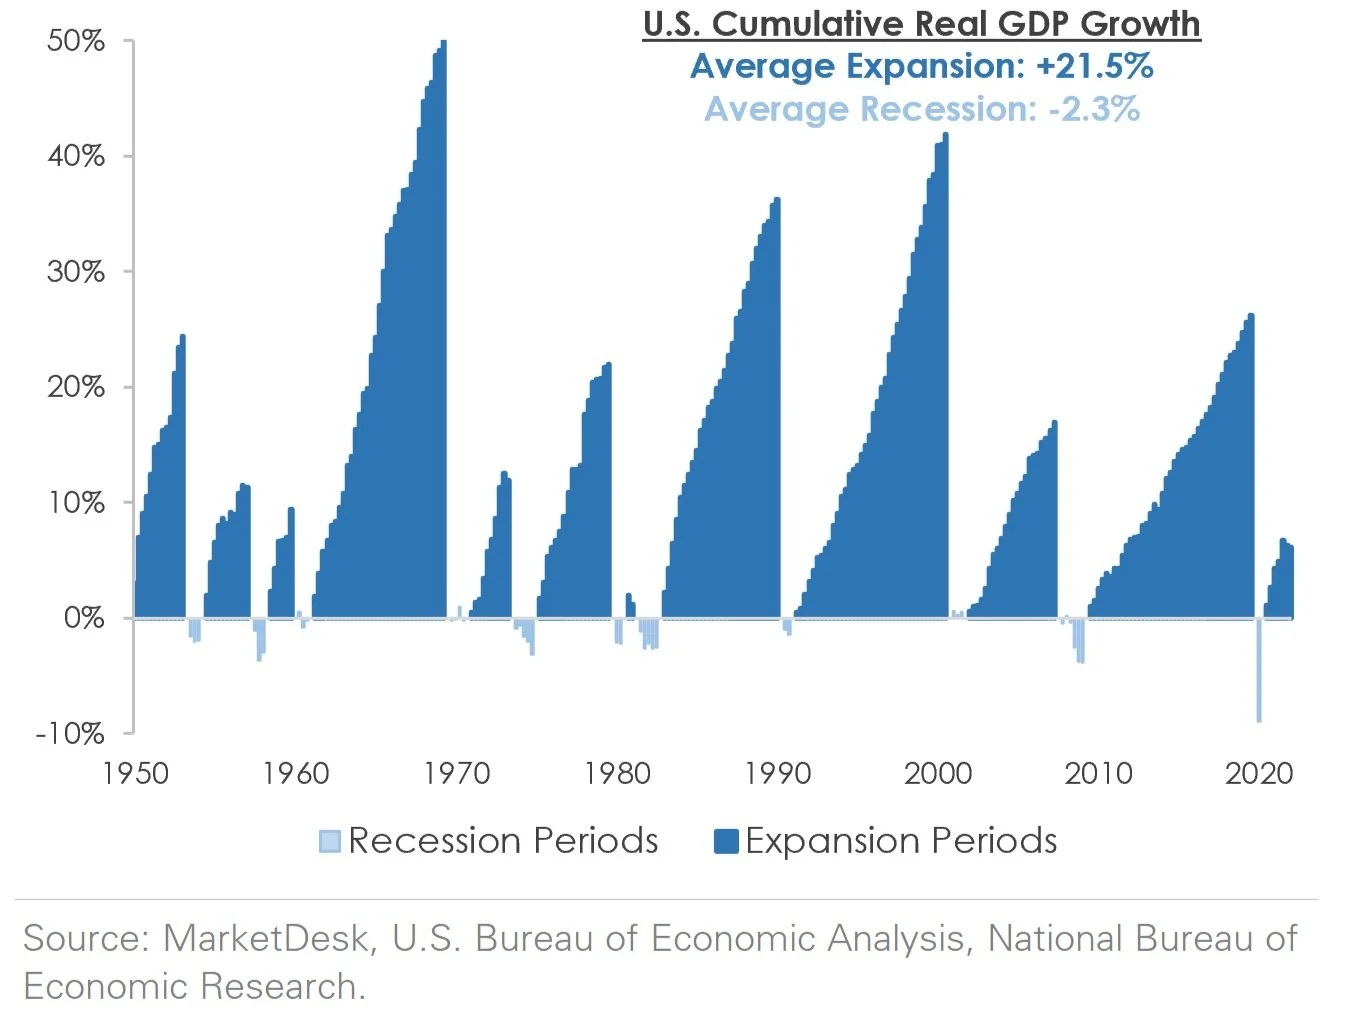
It is helpful to take a step back during volatile market environments like today and look at the bigger picture. The average recession period lasted 13.3 months, with a -2.3% cumulative U.S. GDP contraction. In contrast, the average expansion period lasted 57.2 months, with a cumulative +21.5% U.S. GDP growth. While recessions are painful, the data shows the following expansion periods are powerful.
Volatility is the price of admission to investing in economic progress, technological innovation, increased productivity, and earnings growth. Markets experience both good times and bad, and the bad times can test even the most patient investor. It’s easy to sell and go to cash to relieve anxiety about your portfolio and retirement account, but this often creates a more significant issue – when do you re-enter the market? Lengthening your time horizon increases the odds in your favor.
Our Insights


