The Market Finally Gets the Inflation Number It Wanted
Photo Credit: Benjamin Cheng, Unsplash
Weekly Market Recap for July 12th
This week, the S&P 500 traded above 5,600 for the first time this week. However, the Thursday market rotation after the June CPI release shaped returns. The Russell 2000 gained nearly +4%, outperforming the S&P 500’s +1.1% return. There was also a sharp unwind of the momentum trade, with the Nasdaq 100, Momentum, Growth, and Technology sector underperforming. Long Duration bonds received a boost as yields fell after the June CPI release, the MOVE Index (bond volatility) fell, and USD weakened as the first cut came into view.
S&P 500 Index (Last 12 Months)
S&P 500 Technical Composite (Last 24 Months)
Bullish and Bearish Narratives
Labor Market Data is Softening
Unemployment rates are rising across age groups and genders. The long-term unemployed are taking longer to find jobs, and initial claims are rising. Total employment is flatlining, monthly job growth is slowing, and prior months’ job gain estimates are being revised lower. The data indicates a weakening in the labor market; however, it remains tight. The labor force participation rate for prime-age workers (25–54) is near a 20-year high.
Number of Long-Term Unemployed is Growing
In contrast, the participation rate for individuals 55 and over (i.e., Baby Boomers) is near 2007 levels after recently hitting a new post-pandemic low. The key question is whether the labor market is settling into a steady state or on the brink of deteriorating. It is unclear what could cause a sharp rise in unemployment, as initial claims remain low by historical standards and corporate profits remain strong. One area to monitor is the re-entry of individuals into the labor market. One reason for the rise in unemployment this year is the increased number of individuals re-entering the labor market. For example, unemployment rose to 4.1% in June despite total employment growing by +116,000. Our view is that the labor market is softening, but instead of deteriorating, it’s transitioning into a new state with weakening demand and individuals gradually returning.
Unemployment Rises to November 2021 Level
In summary, the unemployment rate is unlikely to rise sharply this cycle unless a large influx of baby boomers and retirees (i.e., 55 & over age group) back into the market.
June’s CPI Update
Actual: -0.1%
Consensus: +0.1%
Prior: +0.0%.
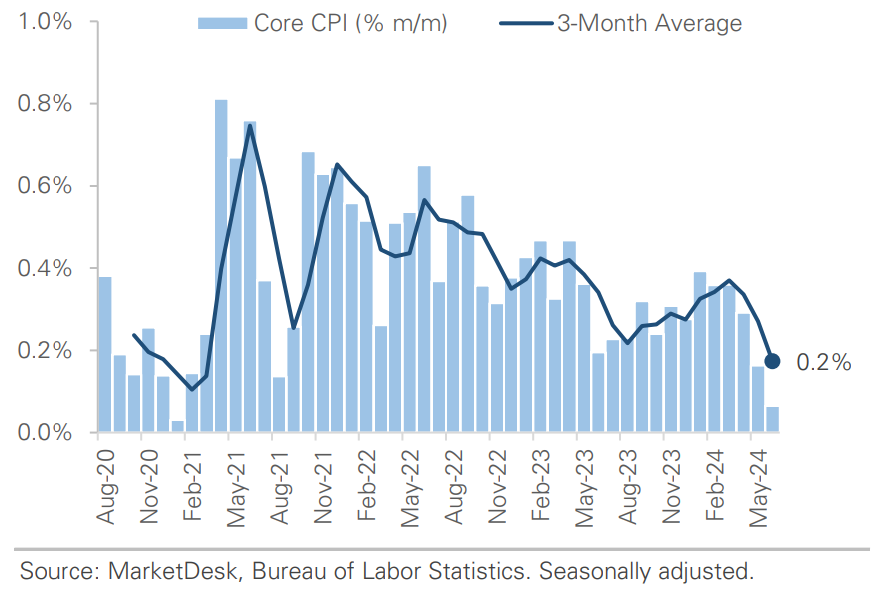
The market finally got the inflation print it wanted. Headline CPI fell by -0.1% in June, the slowest since May 2020. Core CPI rose by +0.1%, the slowest since August 2021. On a year-over-year basis, headline and core CPI rose by +3% and +3.3%. The chart below shows the monthly changes by category, showing continued deflation in goods (Commodities Ex. Food & Energy), lower vehicle prices, and falling energy prices. The Services Ex-Shelter category was flat for a second consecutive month, driven by declining airline fares and easing medical care and vehicle insurance inflation. Shelter continued its disinflationary trend and rose by +0.2%, the slowest pace since August 2021.
Core CPI Falls to August 2021 Level
Monthly Change Across Key Categories
Unlocking the Market
The unemployment and inflation data increased the likelihood of a September rate cut. Investors will now need to look beyond the initial rate cut and start positioning portfolios instead of chasing the momentum trade. The market reacted quickly, with investors scrambling to adjust their portfolios. This year's underperformers, such as small caps, the equal-weight factor, and defensive sectors, traded higher, while the Magnificent 7 and momentum factor experienced a sell-off. We attribute the mini-rotation to traders closing out leveraged long positions in mega-cap stocks and broad index short positions. In the coming weeks, the market will closely watch whether the rotation continues into this year's underperformers. There is much opportunity in the market beyond mega-cap and large-cap stocks.
Look Ahead to Next Week
The big banks kick off Q2 earnings season today, which continues over the next 1.5 months. Earnings expectations are high (particularly for operating margins), so we will watch how results compare to expectations. Next week's economic calendar includes multiple hard data releases like retail sales, industrial production, and housing starts, offering another look at the state of the economy.
This week's economic releases included:
Nonfarm Payrolls
Actual: +206k
Consensus: +190k
Prior: +218k
Commentary: The pace of job growth is slowing from early 2024 levels. April and May were revised lower by a combined -111k. Government, health care, and construction drove gains. Unemployment peaked at 4.1% (a 32-month high) as individuals re-enter the labor market.
Construction Spending (% month over month)
Actual: -0.1%
Consensus: +0.2%
Prior: +0.3%
Commentary: First monthly decline since October 2022. Public construction benefiting from infrastructure bills passed in 2021-2022, while private construction struggles under weight of higher rates.
Important Disclosures
This material is provided for general and educational purposes only and is not investment advice. Your investments should correspond to your financial needs, goals, and risk tolerance. Please consult an investment professional before making any investment or financial decisions or purchasing any financial, securities, or investment-related service or product, including any investment product or service described in these materials.


