Understanding the Current Market Selloff

Photo Credit: Linmaio Xu, Unsplash
Recap of Year-to-Date Market Performance
Stocks started 2025 trading higher but have since pulled back. The S&P 500 has declined more than -8% from its all-time high on February 19th, lowering its year-to-date return to -5%. The Nasdaq 100, an index of technology and growth stocks, is down -7% year-to-date, while the small-cap-focused Russell 2000 has fallen -9%. The Magnificent 7 group includes Microsoft, Apple, Meta, Alphabet, Amazon, Nvidia, and Tesla, and it has declined by nearly 15%. Given the recent volatility, our team wanted to discuss the current environment and provide a market update.
What is Behind the Market Selloff?
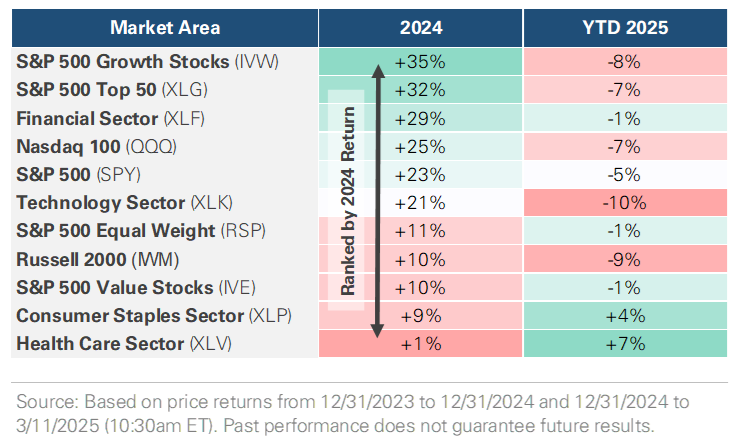
Several factors are contributing to the current market selloff. First, momentum stocks that led the 2024 rally are now experiencing a sharp reversal. The chart below shows 2024’s top performers have become 2025’s underperformers. Technology stocks, the Magnificent 7, and Large Cap Growth powered last year’s gains fueled by enthusiasm for the artificial intelligence industry. However, the concentrated rally led to stretched valuations and crowded positioning, particularly among the biggest companies. As those stocks lose momentum, it triggers a rapid unwind, with a large amount of capital rotating simultaneously. Second, investor exposure to the stock market was high entering 2025. Households’ allocation to stocks reached a record high, and institutional investors, such as pension funds, endowments, and insurance companies, increased their leverage and equity exposure last year as stocks traded higher. Institutional investors and hedge funds are now deleveraging, adding to the selling pressure. Third, optimism around the Trump administration’s pro-growth policies has given way to concern, with worries that spending cuts and the uncertainty created by tariffs will slow economic growth.
Market Volatility vs. Economic Reality
Market volatility can be unsettling, but it’s a normal part of investing. Periods of enthusiasm often lead to recalibration. It is natural to feel uncertain, but history shows that staying invested through volatility and maintaining a longer-term view is a prudent approach. Since 1928, the S&P 500 has experienced a decline of -5% or more in 91 of the past 98 years. Yet, markets have demonstrated an ability to recover and rewarded patience. By maintaining a diversified portfolio aligned with your long-term goals, we are positioned to weather the market’s swings.
S&P 500 Performance

US Market Performance Comparision (2024 vs 2025)
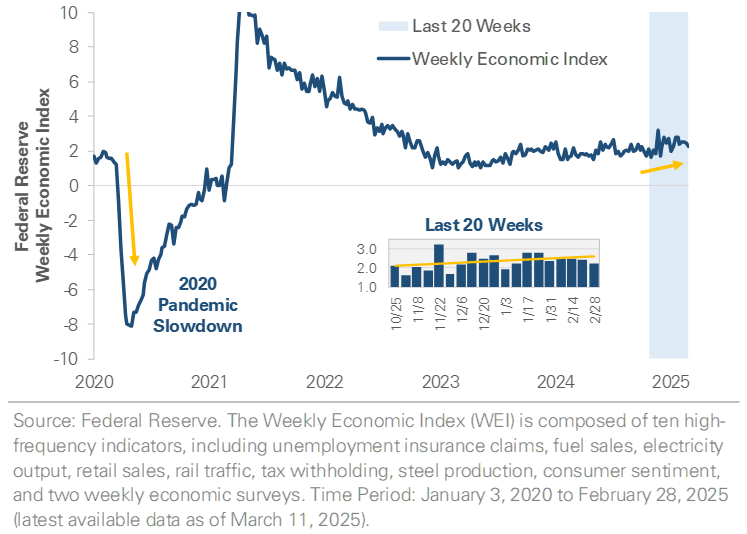
US Weekly Economic Index
US High Yield Bond Spreads (Since 1997)

Important Disclosures
This material is provided for general and educational purposes only and is not investment advice. Your investments should correspond to your financial needs, goals, and risk tolerance. Please consult an investment professional before making any investment or financial decisions or purchasing any financial, securities, or investment-related service or product, including any investment product or service described in these materials.
Our Insights


