Market Selloff, Credit Spreads, Labor Market, Fed Next Week

Photo Credit: Sergey Shmidt, Unsplash
Weekly Market Recap for February 21st
The stock market selloff extended into a third week, with the S&P 500 falling nearly -4% and entering correction territory (-10% below its February peak). Selling pressure remains on mega-cap stocks, with the Nasdaq 100, Growth factor, and Magnificent 7 leading the decline. The Low Volatility, Value, and Equal Weight factors outperformed the S&P 500, while defensive sectors outperformed cyclical ones. International stocks traded lower but continued to outperform US stocks, widening their year-to-date return gap. As discussed below, high yield felt the stress this week, while Treasury bonds traded higher.
Our take: US markets are undergoing a deleveraging phase as crowded positioning becomes a headwind following two years of +20% gains.
S&P 500 Index (Last 12 Months)

S&P 500 Technical Composite (Last 24 Months)

Bull Bear Market Indicator

US Market Economic Cycle

Key Takeaways
#1 - This Selloff Ranks Among the Biggest and Fastest
Since late February, the S&P 500 has dropped -7%. The only other risk-off regimes with a bigger and faster drawdown were July 2002, July 2011, and February 2020.
Implication: The speed and magnitude of this selloff are significant by historical standards.
Risk Demand Indicator - 1st Month Selloffs
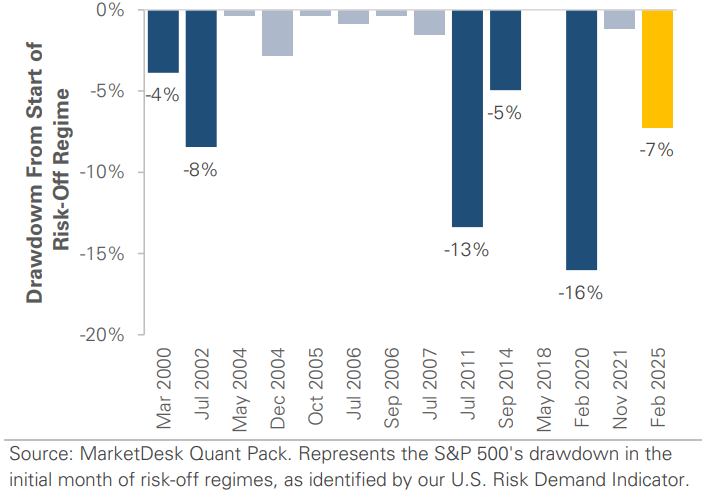
#2 - Risk-Off Regimes with Big Early Losses Share a Common Theme
The common theme is event-driven fears: corporate fraud in 2002, a US debt downgrade in 2011, and COVID-19 in 2020. In each case, the S&P 500 recovered most of its early losses within three months, although there was volatility.
Implication: Event-driven selloffs historically try to rebound if uncertainty fades. Combined with the market’s tendency to buy dips, this would increase the probability of a near-term bounce.
#3 - High-Yield Credit Spreads Widened
Turmoil in the equity market spilled over into the bond market. The chart shows the high-yield credit spread rose above 3.20%, the highest level since late September 2024.
Implication: Last week, we noted the lack of confirmation from high yield, but this week’s widening spread suggests risk appetites are deteriorating beyond equities.
High-Yield Credit Spreads Expand to a 5-Month High

#4 - Labor Market Softens in February
The Labor Market Softened in February as unemployment rose by +0.1% to 4.1%, with labor market reentrants contributing over half of the increase. Job growth totaled +151k, led by health care, but January's gains were revised down from +143k to +125k.
Implication: Markets were disappointed by the report, particularly after January's slowdown and with DOGE-related government job cuts that are not expected to show up in the data until next month.
US Unemployment Rate Rises as Labor Market Softens

#5 - Inflation Cooled in February
The headline CPI rose by +0.2% m/m and +2.8% year over year, both slowing from January. The core CPI, excluding energy and food, rose by +0.2% m/m and +3.1%, the smallest increase since April 2021.
Implication: Easing inflation gives the Fed room to resume its rate-cutting cycle with potentially more than 2 cuts, although recent tariffs add uncertainty.
Core CPI Falls to April 2021 Levels

#6 - Upcoming March FOMC Meeting
The Fed's March FOMC meeting will occur next week, and there will most likely be no rate cut. The highlights will be Chair Powell's press conference and the Fed's updated Summary of Economic Projections. We expect the Fed to revise its GDP estimate lower, raise its unemployment estimate, and signal the potential for more rate cuts.
Implication: A lot has changed since the last Fed meeting in January, and markets will be watching closely to see how the Fed's views have changed.
#7 - Upcoming Economic Calendar
Next week's economic calendar includes retail sales, building permits, housing starts, and industrial production. The data will provide insight into whether January's slowdown (cold weather and California wildfires) was temporary or the start of a new trend. It will also offer an early look at how policy uncertainty and tariffs are impacting the economy.
Implication: The Citi Surprise Index turned negative in February as economic data fell short of expectations. Any hint of solid economic data could alleviate growth concerns and ease market selling pressure.
Important Disclosures
This material is provided for general and educational purposes only and is not investment advice. Your investments should correspond to your financial needs, goals, and risk tolerance. Please consult an investment professional before making any investment or financial decisions or purchasing any financial, securities, or investment-related service or product, including any investment product or service described in these materials.
Our Insights


