Multiple Indicators Signal a Choppy Summer

Photo Credit: David Everett Strickler, Unsplash
Weekly Market Recap for May 24, 2024
Stronger-than-expected measures on the health of the domestic services and manufacturing sectors triggered yesterday’s stock market decline. This month’s Standard & Poor’s (S&P) services Purchasing Managers Index (PMI) rose to 54.8 from 51.3. The S&P manufacturing PMI hit 52.4, versus 51.1 in April. Such data suggest that the Fed may be more hesitant to reduce interest rates over the near term.
Early this morning, preliminary durable goods figures for April were released. Monthly orders increased by 0.7%, versus economists’ outlook for a 1.0% decline, and the revised 0.8% advance was recorded for March. These latest favorable performances depict the broader economy’s resilience to lingering inflation and elevated interest rates.
If the US economy can continue to expand without accelerating wage growth and inflation, stocks likely would gain further ground, though incrementally. The Federal Reserve's rate cuts would provide support. We expect rates to be lower by the end of the year, along with an increase in market volatility later in this presidential election year.
S&P 500 Index (Last 12 Months)

S&P 500 Technical Composite (Last 24 Months)

Update on Underlying Market Liquidity
The chart below, a crucial tool for tracking market liquidity, displays our US Net Liquidity Indicator (USNLI). It reveals a concerning trend-market liquidity is deteriorating. USNLI, which experienced a surge in Q4 2023, has now fallen below the critical 50% threshold after reaching its peak in February.
What is causing the liquidity contraction?
First, the Fed continues to shrink its balance sheet via quantitative tightening (QT). While the pace of QT will slow in June, the Fed's balance sheet will continue to shrink. Second, the Treasury General Account has grown to $850 billion as the US Treasury raises money to fund the widening government deficit. The growing pile of longer maturity Treasury notes and bonds offers an alternative to stocks, leading some investors to sell stocks and buy bonds. The third USNLI component, reverse repurchase agreements (RRP), has transitioned from enhancing liquidity to weakening liquidity. RRP plunged -53% during the past six months. Our assumption is that a significant portion of the excess cash in money market funds rotated back into the equity market during the recent rally, boosting liquidity and fueling the S&P 500's rally. However, RRP usage stabilized over the past two months and ticked higher. Interest rates are forecast to remain current for most of 2024, and investors could rotate back into money market funds to take advantage of high cash yields. If USNLI continues to move lower, the stock market could experience a choppy summer as market liquidity deteriorates.
US Net Liquidity Indicator

Equity Markets Impact
The S&P 500 vs US Net Liquidity Indicator chart below shows the S&P 500 tends to trade higher and experience less volatility when USNLI is above the 50th percentile. In contrast, the S&P 500 tends to experience more volatility with more significant drawdowns when USNLI is below 50. In general, forward returns and win rates are both below average when USNLI is below 50, like today. Even as market liquidity contracts, investors are feeling optimistic as summer approaches, with the S&P 500 trading near an all-time high. Our US Investor Sentiment Indicator (USSI) rebounded after the April sell-off and is now above 70%, which historically translates into below-average returns and win rates. The combination of a below 50% USNLI reading (deteriorating liquidity), a +70% USSI reading (strong sentiment), and a mid-50s US Breadth Indicator (USBI) reading all suggest caution is warranted.
S&P 500 vs US Net Liquidity Indicator

Investor Risk Appetite Remains Strong
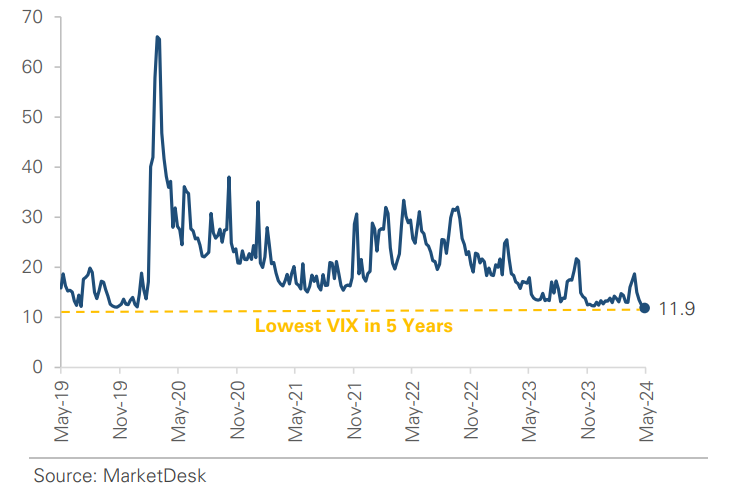
Our USNLI, USSI, and USBI indicators favor a cautious approach, but our US Risk Demand Indicator (USRDI) shows that risk appetite remains strong. One USRDI component, the corporate high-yield credit spread, demonstrates the market's risk appetite. The chart below shows the high yield credit spread is near 3%, a level that is not only a post-pandemic low but also among the lowest levels since before the 2008 financial crisis. In addition, the CBOE VIX chart recently made a new post-pandemic low. With USRDI above 0, history indicates drawdown risk is below average. Investors will likely keep buying the dips until a change in the narrative and sentiment weakens.
High-Yield Credit Spread Remains Historically Tight

VIX Sits at a Post-Pandemic Low
Recap of May Fed Meeting Minutes
The Fed released its May meeting minutes this week, and the headlines were unsurprisingly hawkish. Multiple statements stood out to us, including uncertainty regarding the restrictiveness of financial conditions, disappointment over first-quarter inflation data, and a willingness to tighten further. Our recent market updates have discussed the Fed's asymmetric policy stance: a high bar to hike rates and a low bar to cut. The meeting minutes make that policy stance more two-sided but do not represent a material change. We expect the market to keep overreacting to every data point, while the Fed is likely to react more slowly and deliberately as it monitors incoming data. The probability of 2024 rate cuts continues to diminish.
Weekly Mortgage Applications Continue to Grow
Weekly Mortgage Applications
Actual: +1.9%
Prior: +0.5%
Increased for the third consecutive week with 30-year fixed-rate mortgage falling for the third week; refinance index jumped +7% week-over-week. As mentioned last week, the market continues to prematurely loosen financial conditions and spur economic activity. While this benefits economic activity in the near term, it makes the Fed's job more challenging in the longer term.
Important Disclosures
This material is provided for general and educational purposes only and is not investment advice. Your investments should correspond to your financial needs, goals, and risk tolerance. Please consult an investment professional before making any investment or financial decisions or purchasing any financial, securities, or investment-related service or product, including any investment product or service described in these materials.
Our Insights


