Soft Survey Data Leads to an Economic Growth Scare

Photo Credit: Albert Stoynov, Unsplash
Weekly Market Recap for June 8th
This week, the Bureau of Labor Statistics released May’s employment data, which showed 272,000 jobs were added to the economy, exceeding the expected increase of 190,000 and the revised prior-month tally of 165,000. Conversely, the unemployment rate ticked up to 4.0%, versus economists’ outlook of 3.9% and the April level, which was also 3.9%
In addition, the S&P 500 set a new all-time high as Nvidia surpassed $3 trillion in market cap. So far in 2024, the NASDAQ, S&P 500, and the Dow have performed solidly, up 16.3%, 12.9%, and 3.1%, respectively.
The U.S. economy is holding firm, though pockets of softness are appearing. Wall Street optimism that the Fed will cut short-term interest rates in September is fading. We remain bullish on the US economy and recommend a diversified portfolio of stock-sector leaders.
S&P 500 Index (Last 12 Months)

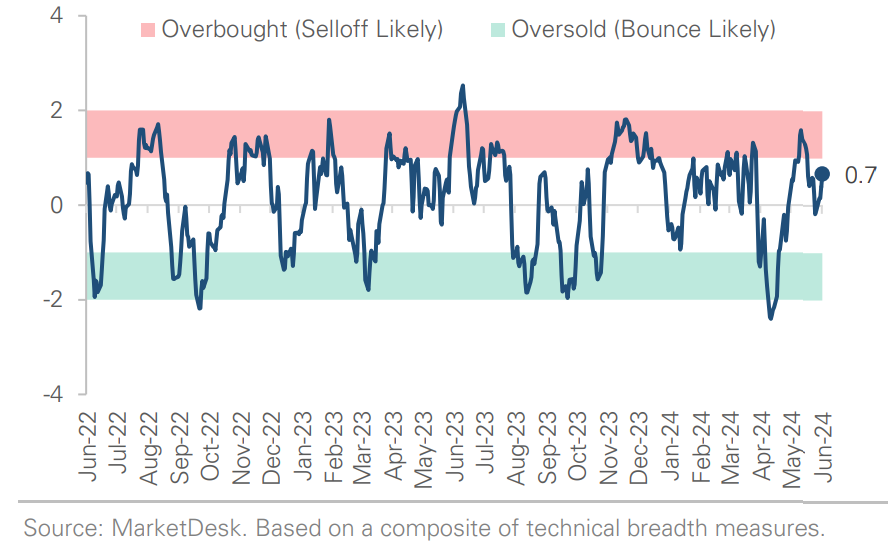
S&P 500 Technical Composite (Last 24 Months)
S&P Sets New All-Time High
The S&P 500 set a new all-time high this week as Nvidia surpassed $3 trillion in market cap. This week’s equity market performance was top-heavy, with the top 50 S&P 500 companies returning over +2.5%. For comparison, the S&P 500 equal weight index returned +0.7%. The rally resulted in typical factor performance trends, with Growth and the Nasdaq 100 outperforming. Soft survey data caused the 10-year Treasury yield to fall from 4.55% last Friday to 4.30% on Thursday, causing longer-duration bond proxies to outperform. Despite the soft economic data, the high-yield credit spread held steady, indicating that investor risk appetite remains solid. Falling yields should have benefited rate-sensitive stocks, like the Russell 2000, but the group traded lower this week. Small caps’ underperformance signals growing investor concern about the economy.
Nvidia Surpasses $3 Trillion in Market Cap

Economic Growth Scare
The Investors are increasingly concerned about the economy. It started last Friday when April personal consumption expenditures (PCE) came in softer than expected. The narrative gained momentum on Monday when ISM Mfg PMI came in below consensus, with the New Orders Index falling to a 12-month low. The Atlanta Fed’s 2Q24 GDPNow forecast fell to 1.8% from 2.7% last week and 4.2% in mid-May. On Tuesday, the JOLTS survey revealed a decline in job openings (8,059k actual vs 8,360k estimate and 8,355k previous month). To complicate matters, the May ISM Services PMI came above consensus after signaling contraction in April. The May nonfarm payrolls report will be released by the time this is published, providing one of May’s first ‘hard’ datasets. The nonfarm payrolls release will provide more context around the slowdown narrative, with analysts forecasting +180k job gains and unemployment holding steady at 3.9%. Additional hard data for May will come the week of 6/17, when retail sales, industrial production, and housing activity are released. We will monitor the hard data to see if it supports or contradicts the soft data.
Manufacturing & Services Activity Diverge

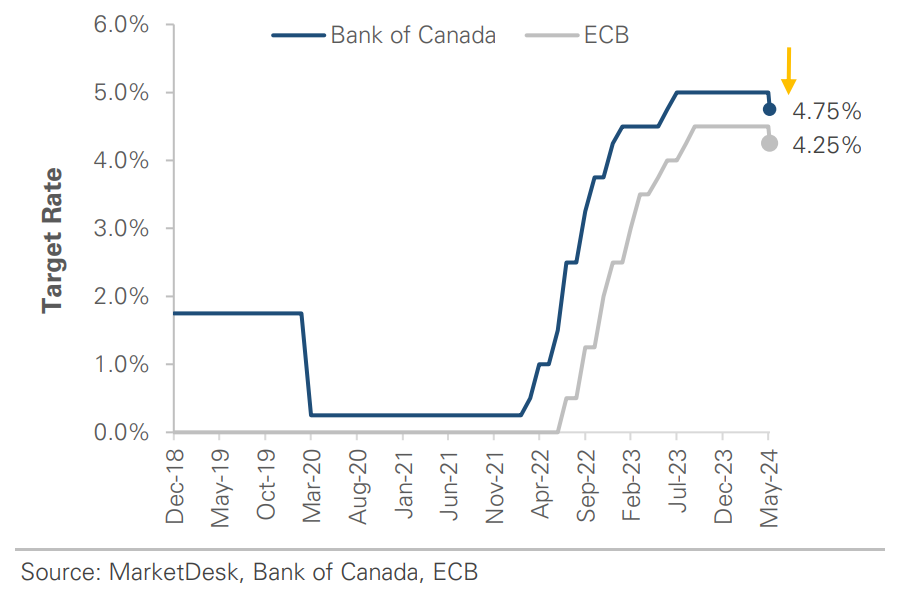
Canada & European Central Bank Begin Easing Cycle
The Bank of Canada (BoC) and ECB both cut their benchmark rates by -0.25% this week, kicking off the G7 easing cycle. BoC officials are confident that inflation is approaching 2%, but they emphasize that the path depends on continued inflation progress. The ECB raised its inflation forecast for 2024 and 2025 by +0.2% to 2.5% and 2.2%, respectively, while providing limited guidance. How far behind is the first Fed rate cut? According to the CME's FedWatch Tool, investors assign a 0% probability of a cut next week, a 16.5% probability of a cut in July, and a nearly 70% chance in September. The recent soft patch of survey data pulled the initial cut to September. The macro-environment matters more than the timing of the first cut. Our view is unchanged from the March report: given the current state of the economy, this is more likely to be a mid-cycle regime (i.e., proactive but with fewer total cuts).
Bank of Canada & ECB Kick Off the G7 Easing Cycle
Market Breadth Remains Range Bound
The Despite the S&P 500 setting a new all-time high this week, market breadth, as measured by our U.S. Breadth Indicator (USBI), remains in the 50s. It continues to signal below-average returns and win rates with many outcomes. When USBI is between 40 and 60, the average 1-, 2-, and 3- month forward returns are flat (compared to +1% to +2% for all periods), with win rates between 50% and 60% (compared to mid-60% for all periods). In essence, market breadth needs to be more robust to signal all clearly and not weak enough to skew risk/reward more positively. Our near-term outlook remains the same: a choppy summer with muted gains as the market searches for direction.
Net Liquidity Remains a Headwind
Net liquidity, measured by our U.S. Net Liquidity Indicator (USNLI), remains near the 40th percentile. Like USBI, USNLI signals below-average returns and win rates. The combination highlights an indecisive market that is challenging to trade, with the possibility of stocks trading lower. However, the two indicators should not be seen as reasons to become bearish but as tools to set expectations. While they signal near-term caution, the two indicators do not change the overall picture: strong investor risk demand and a willingness to buy-the-dip.
Looking Ahead to Next Week
Next Monday and Tuesday will be slow macro-wise before the calendar becomes active later in the week. The Fed holds its June FOMC meeting on Tuesday and Wednesday, ending with the release of an updated Summary of Economic Projections and a press conference Wednesday afternoon. May CPI and PPI data will be released on Wednesday and Thursday mornings. In the credit market, the Treasury will auction off 10Y and 30Y bonds on Tuesday and Thursday, helping to gauge the market's demand for long-duration Treasury bonds. This week's economic data releases included:
Personal Consumption Expenditures
Actual: +0.2%
Consensus: +0.3%
Prior: +0.7%
Commentary: Slowdown after two consecutive months of strong spending; goods spending slowed, while services spending grew; core PCE (ex. Food & energy) rose by +0.2%, suggesting inflation is moderating; inflation-adjusted spending fell by -0.1%, raising concerns about soft consumer spending.
ISM Mfg PMI
Actual: 48.7
Consensus: 49.5
Prior: 49.2
Commentary: Second consecutive decline; New Orders Index fell to 12-month low; Production fell -1.1pts to 50.2 & Prices Paid fell -3.9pts to 57.
ISM Services PMI
Actual: 53.8
Consensus: 50.8
Prior: 49.4
Commentary: Highest reading in 2024, following the weakest reading in 2024 (April); business activity spiked from 50.9 in April to 61.2 in May
1Q24 GDP -First Revision
Actual: +1.3%
Initial Estimate: +1.6%
Commentary: GDP growth slower than initially reported, primarily reflecting softer consumer spending; stronger business & residential investment partially offset the downward revision to spending.
Important Disclosures
This material is provided for general and educational purposes only and is not investment advice. Your investments should correspond to your financial needs, goals, and risk tolerance. Please consult an investment professional before making any investment or financial decisions or purchasing any financial, securities, or investment-related service or product, including any investment product or service described in these materials.
Our Insights


